
The transformation of a municipal solid waste disposal site from an environmental liability into a profitable energy asset requires a feasibility study that is less about optimistic theoretical modeling and more about rigorous field verification where the stochastic nature of anaerobic decomposition must be quantified against the rigid financial requirements of the power market. Landfills are living biological reactors. They breathe. The gas flow fluctuates. Understanding this volatility is the first step. Landfill gas power projects fail when engineers treat them like steady-state natural gas plants. They succeed when the design accommodates change.
The Foundation: Methane Flow Rate Measurement and Resource Assessment
The greatest risk in any LFG to energy project is the overestimation of the fuel resource. While theoretical models like EPA's LandGEM provide a curve based on waste tonnage and acceptance rates, relying solely on these projections for multi-million dollar investment decisions is financial negligence. You need physical data.Test Wells and Pumping Trials
Before ordering a single engine, the engineering team must conduct an active pumping trial using test extraction wells drilled into the waste mass to determine the radius of influence (ROI) and the specific methane generation rate of the site’s unique waste composition. Theoretical models assume ideal conditions. Real waste is heterogeneous. We measure the "recovery rate," not just the generation rate.Gas Quality Analysis
Methane flow rate measurement is meaningless without analyzing the gas composition.- Methane (CH4): Should be > 45% for stable operation.
- Oxygen (O2): Must be < 1% to prevent subsurface fires and anaerobic inhibition.
- Contaminants: Siloxanes and Hydrogen Sulfide (H2S) define the gas cleaning CAPEX.
System Design: Collection Efficiency and Sizing Logic
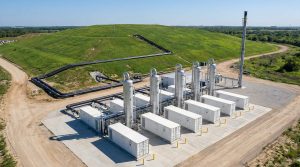
The gas collection system (GCS) is the lungs of the project. It consists of vertical extraction wells, horizontal trenches, and a network of header pipes under vacuum that pulls the gas to the plant.Flare vs. Power Generation Scenarios
Regulatory compliance often mandates a flare system to control odors and methane emissions reduction regardless of energy utilization.- The Flare Scenario: It destroys methane but wastes energy. It is a sunk cost (CAPEX + OPEX) with zero revenue.
- The Power Plant Scenario: It turns the compliance cost into a revenue stream. The flare becomes the emergency backup.
Landfill Gas Generator Sizing Strategy
Landfill gas generator sizing is the most critical design decision. The gas production curve of a landfill is not flat; it rises quickly after closure and then declines exponentially over 20 years.- The Error: Sizing for the "Peak Year". This leaves engines underloaded (and inefficient) for 80% of the project life.
- The Strategy: Modular sizing. Install multiple smaller units (e.g., three 1 MW engines) instead of one large unit. This allows you to step down capacity as the gas curve declines.
Financial Modeling: CAPEX and OPEX Breakdown
A robust landfill gas feasibility study requires a transparent breakdown of costs. LFG projects are capital intensive but offer low fuel costs.Capital Expenditure (CAPEX) Categories
- Gas Collection System (GCS): Drilling wells, piping, blower skids. (~20-25%)
- Gas Pre-Treatment: Scrubber vessels, siloxane removal (activated carbon), dehumidifiers. (~10-15%)
- Power Generation Block: Special LFG engines, generators, switchgear, containerization. (~40-50%)
- Civil and Grid Connection: Foundations, transformers, transmission lines. (~15-20%)
Operational Expenditure (OPEX) Realities
LFG CAPEX OPEX models differ from natural gas. LFG is a "dirty" fuel.- Maintenance: LFG engines require more frequent oil changes and cylinder head overhauls due to acid formation and deposits.
- Consumables: Activated carbon media for siloxane removal is a significant recurring cost.
- Standard Metric: OPEX is typically calculated as "Cents per kWh" produced.
Revenue Streams and Payback Calculation
The landfill gas payback period is determined by the "Spark Spread"—the difference between the cost of producing energy (fuel is free, but collection costs money) and the sales price.Revenue Components
- Electricity Sales: Sold to the grid via PPA (Power Purchase Agreement) or used on-site to offset retail rates.
- Heat Recovery: If the landfill is near a greenhouse or factory, waste heat can be sold.
- Carbon Credits: In some markets, destroying methane generates tradeable carbon offsets.
- Gate Fees (Tipping Fees): While not direct energy revenue, the power plant extends the landfill's lifespan.
The Payback Formula (Simplified)
We calculate the Simple Payback Period using the following text-based logic:- Net Annual Revenue = (Total kWh Sold × PPA Price) + Carbon Credit Revenue - (Annual OPEX + Insurance + Administration).
- Payback Years = Total Project CAPEX / Net Annual Revenue.
Sensitivity Analysis: Stress-Testing the Model
A static spreadsheet cannot predict the future. Sensitivity analysis tests how the project performs when variables change. This is the "What If" phase.| Variable | Sensitivity Scenario | Impact on ROI | Mitigation Strategy |
| Gas Decline | Production drops 20% faster than modeled. | Severe (Stranded Assets). | Modular engine deployment; Periodic wellfield tuning. |
| Grid Price | Electricity tariff drops by 10%. | Moderate. | Long-term fixed-price PPA. |
| Siloxane Load | Siloxane ppm doubles. | High (OPEX increase). | Regenerative media filters; accurate initial sampling. |
| Uptime | Availability drops to 85%. | High (Revenue loss). | On-site spare parts; strict maintenance contracts. |